
In this article, we describe the Pinpoint’s techniques such as transaction tracing and bytecode instrumentation. And we explain the optimization method applied to Pinpoint Agent, which modifies bytecode and record performance data.
Distributed Transaction Tracing, Modeled after Google’s Dapper
Pinpoint traces distributed requests in a single transaction, modeled after Google’s Dapper.
How Distributed Transaction Tracing Works in Google’s Dapper
The purpose of a distributed tracing system is to identify relationships between Node 1 and Node 2 in a distributed system when a message is sent from Node 1 to Node 2 (Figure 1).
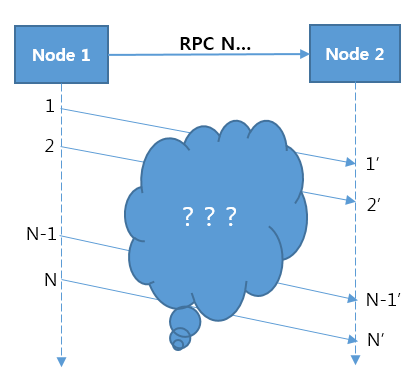
Figure 1. Message relationship in a distributed system
The problem is that there is no way to identify relationships between messages. For example, we cannot recognize relationships between N messages sent from Node 1 and N’ messages received in Node 2. In other words, when X-th message is sent from Node 1, the X-th message cannot be identified among N’ messages received in Node 2. An attempt was made to trace messages at TCP or operating system level. However, implementation complexity was high with low performance because it should be implemented separately for each protocol. In addition, it was difficult to accurately trace messages.
However, a simple solution to resolve such issues has been implemented in Google’s Dapper. The solution is to add application-level tags that can be a link between messages when sending a message. For example, it includes tag information for a message in the HTTP header at an HTTP request and traces the message using this tag.
Google’s Dapper
For more information on Google’s Dapper, see “Dapper, a Large-Scale Distributed Systems Tracing Infrastructure.”
Pinpoint is modeled on the tracing technique of Google’s Dapper but has been modified to add application-level tag data in the call header to trace distributed transactions at a remote call. The tag data consists of a collection of keys, which is defined as a TraceId.
Data Structure in Pinpoint
In Pinpoint, the core of data structure consists of Spans, Traces, and TraceIds.
- Span: The basic unit of RPC (remote procedure call) tracing; it indicates work processed when an RPC arrives and contains trace data. To ensure the code-level visibility, a Span has children labeled SpanEvent as a data structure. Each Span contains a TraceId.
- Trace: A collection of Spans; it consists of associated RPCs (Spans). Spans in the same trace share the same TransactionId. A Trace is sorted as a hierarchical tree structure through SpanIds and ParentSpanIds.
- TraceId: A collections of keys consisting of TransactionId, SpanId, and ParentSpanId. The TransactionId indicates the message ID, and both the SpanId and the ParentSpanId represent the parent-child relationship of RPCs.
- TransactionId (TxId): The ID of the message sent/received across distributed systems from a single transaction; it must be globally unique across the entire group of servers.
- SpanId: The ID of a job processed when receiving RPC messages; it is generated when an RPC arrives at a node.
- ParentSpanId (pSpanId): The SpanId of the parent span which generated the RPC. If a node is the starting point of a transaction, there will not be a parent span - for these cases, we use a value of -1 to denote that the span is the root span of a transaction.
Differences in terms between Google’s Dapper and NAVER’s Pinpoint
The term “TransactionId” in Pinpoint has the same meaning as the term “TraceId” in Google’s Dapper and the term “TraceId” in Pinpoint refers to a collection of keys.
How TraceId Works
The figure below illustrates the behavior of a TraceId in which RPCs were made 3 times within 4 nodes.
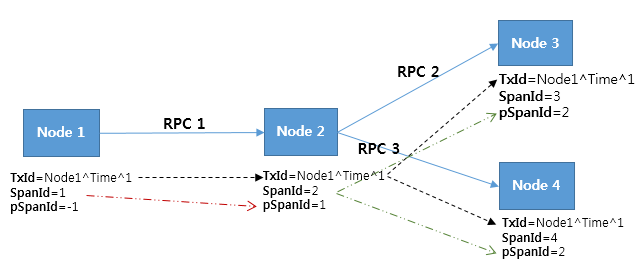
Figure 2. Example of a TraceId behavior
A TransactionId (TxId) represents that three different RPCs are associated with each other as a single transaction in Figure 2. However, a TransactionId itself can’t explicitly describe the relationship between RPCs. To identify the relationships between RPCs, a SpanId and a ParentSpanId (pSpanId) are required. Suppose that a node is Tomcat. You can think of a SpanId as a thread which handles HTTP requests. A ParentSpanId indicates the SpainId of a parent that makes RPC calls.
Pinpoint can find associated n Spans using a TransactionId and can sort them as a hierarchical tree structure using a SpanId and a ParentSpanId.
A SpanId and a ParentSpanId are 64-bit long integers. A conflict might arise because the number is generated arbitrarily, but considering the range of value from -9223372036854775808 to 9223372036854775807, this is unlikely to happen. If there is a conflict between keys, Pinpoint as well as Google’s Dapper lets developers know what happened, instead of resolving the conflict.
A TransactionId consists of AgentIds, JVM (Java virtual machine) startup time, and SequenceNumbers.
- AgentId: A user-created ID when JVM starts; it must be globally unique across the entire group of servers where Pinpoint has been installed. The easiest way to make it unique is to use a hostname ($HOSTNAME) because the hostname is not duplicate in general. If you need to run multiple JVMs within the server group, add a postfix to the hostname to avoid duplicates.
- JVM startup time: Required to guarantee a unique SequenceNumber which starts with zero. This value is used to prevent ID conflicts when a user creates duplicate AgentId by mistake.
- SequenceNumber: ID issued by the Pinpoint Agent, with sequentially increasing numbers that start with zero; it is issued per message.
Dapper and Zipkin, a distributed systems tracing platform at Twitter, generate random TraceIds (TransactionIds in Pinpoint) and consider conflict situations as a normal case. However, we wanted to avoid this conflict as much as possible in Pinpoint. We had two available options for this; one with a method in which the amount of data is small but the probability of conflict is high; the other is a method in which the amount of data is large but the probability of conflict is low; We chose the second option.
There may be a better ways to handle transactions. We came up with several ideas such as key issue by a central key server. But we didn’t implement this in the system due to performance issues and network errors. We are still considering issuing keys in bulk as an alternative Solution. So maybe later in the future, such methods can be developed; But for now, a simple method is adopted. In Pinpoint, a TransactionId is regarded as changeable data.
Bytecode Instrumentation, Not Requiring Code Modifications
Earlier, we explained distributed transaction tracing. One way for implementing this is that developers to modify their code by themselves. Allow developers to add tag information when an RPC is made. However, it could be a burden to modify code even though such functionality is useful to developers.
Twitter’s Zipkin provides the functionality of distributed transaction tracing using modified libraries and its container (Finagle). However, it requires the code to be modified if needed. We wanted the functionality to work without code modifications and desired to ensure code-level visibility. To solve such problems, the bytecode instrumentation technique was adopted in Pinpoint. The Pinpoint Agent intervenes code to make RPCs so as to automatically handle tag information.
Overcoming Disadvantages of Bytecode Instrumentation
There are two ways for distributed transaction tracing as below. Bytecode instrumentation is one of an automatic method.
- Manual method: Developers develop code that records data at important points using APIs provided by Pinpoint.
- Automatic method: Developers do not involve code modifications because Pinpoint decides which API is to be intervened and developed.
Advantages and disadvantages of each method are as follows:
Table 1 Advantages and disadvantage of each method
| Item | Advantage | Disadvantage |
|---|---|---|
| Manual Tracing | - Requires less development resources. - An API can become simpler and consequently the number of bugs can be reduced. |
- Developers must modify the code. - Tracing level is low. |
| Automatic Tracing | - Developers are not required to modify the code. - More precise data can be collected due to more information in bytecode. |
- It would cost 10 times more to develop Pinpoint with automatic method. - Requires highly competent developers who can instantly recognize the library code to be traced and make decisions on the tracing points. - Can increase the possibility of a bug due to high-level development skills such as bytecode instrumentation. |
Bytecode instrumentation is a technique that includes high difficulty level and risks. Nevertheless, using this technique has many benefits.
Although it requires a large number of development resources, it requires almost none for applying the service. For example, the following shows the costs between an automatic method which uses bytecode instrumentation and a manual method which uses libraries (in this context, costs are random numbers assumed for clarity).
- Automatic method: Total of 100
- Cost of Pinpoint development: 100
- Cost of services applied: 0
- Manual method: Total of 30
- Cost of Pinpoint development: 20
- Cost of services applied: 10
The data above tells us that a manual method is more cost-effective than an automatic one. However, it will not guarantee the same result for NAVER since we have thousands of services. For example, if we have 10 services which require being modified, the total cost will be calculated as follows:
- Cost of Pinpoint development 20 + Cost of services applied 10 x 10 services = 120
As you can see, the automatic method was more cost-efficient for us.
We are lucky to have many developers who are highly competent and specialized in Java in the Pinpoint team. Therefore, we believed it was only a matter of time to overcome the technical difficulties in Pinpoint development.
The Value of Bytecode Instrumentation
The reason we chose to implement bytecode instrumentation(Automatic method) is not only those that we have already explained but also the following points.
Hidden API
If the API is exposed for developers to use. We, as API providers, are restricted to modify the API as we desire. Such a restriction can impose stress on us.
We may modify an API to correct mistaken design or add new functions. However, if there is a restriction to do this, it would be difficult for us to improve the API. The best answer for solving such a problem is a scalable system design, which is not an easy option as everyone knows. It is almost impossible to create perfect API design as we can’t predict the future.
With bytecode instrumentation, we don’t have to worry about the problems caused by exposing the tracing APIs and can continuously improve the design, without considering dependency relationships. For those who are planning to develop their applications using Pinpoint, please note that API can be changed by the Pinpoint developers since improving performance and design is our first priority.
Easy to Enable or Disable
The disadvantage of using bytecode instrumentation is that it could affect your applications when a problem occurs in the profiling section of a library or Pinpoint itself. However, you can easily solve it by just disabling the Pinpoint since you don’t have to change any code.
You can easily enable Pinpoint for your applications by adding the three lines (associated with the configuration of the Pinpoint Agent) below into your JVM startup script:
-javaagent:$AGENT_PATH/pinpoint-bootstrap-$VERSION.jar
-Dpinpoint.agentId=<Agent's UniqueId>
-Dpinpoint.applicationName=<The name indicating a same service (AgentId collection)>
If any problem occurs due to Pinpoint, you can just delete the configuration data in the JVM startup script.
How Bytecode Instrumentation Works
Since bytecode instrumentation technique has to deal with Java bytecode, it tends to increase the risk of development while it decreases productivity. In addition, developers are prone to make mistakes. In Pinpoint, we improved productivity and accessibility by abstraction with the interceptor. Pinpoint injects necessary codes to track distributed transactions and performance information by intervening application code at class loading time. This increases performance since tracking codes are directly injected into the application code.
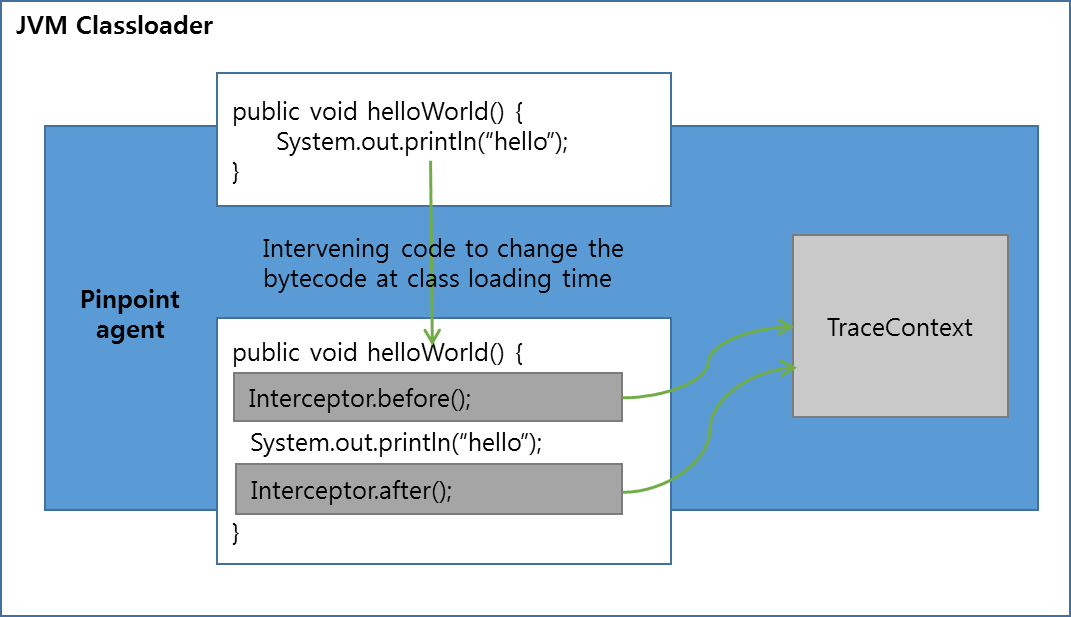
Figure 3. Basic principle of bytecode instrumentation
In Pinpoint, the API intercepting part and data recording part are separated. Interceptor is injected into the method that we’d like to track and calls before() and after() methods where data recording is taken care of. Through bytecode instrumentation, Pinpoint Agent can record data only from the necessary method which makes the size of profiling data compact.
Optimizing Performance of the Pinpoint Agent
Finally, we will describe how to optimize the performance of Pinpoint Agent.
Using Binary Format (Thrift)
You can increase encoding speed by using a binary format (Thrift). Although it is difficult to use and debug, It can improve the efficiency of network usage by reducing the size of data generated.
Optimize Recorded Data for Variable-Length Encoding and Format
If you convert a long integer into a fixed-length string, the data size will be 8 bytes. However, if you use variable-length encoding, the data size can vary from 1 to 10 bytes depending on the size of a given number. To reduce data size, Pinpoint encodes data as a variable-length string through Compact Protocol of Thrift and records data to be optimized for encoding format. Pinpoint Agent reduces data size by converting remaining time based on root method into a vector value.
Variable-length encoding
For more information on the variable-length encoding, see “Base 128 Varints” in Google Developers.
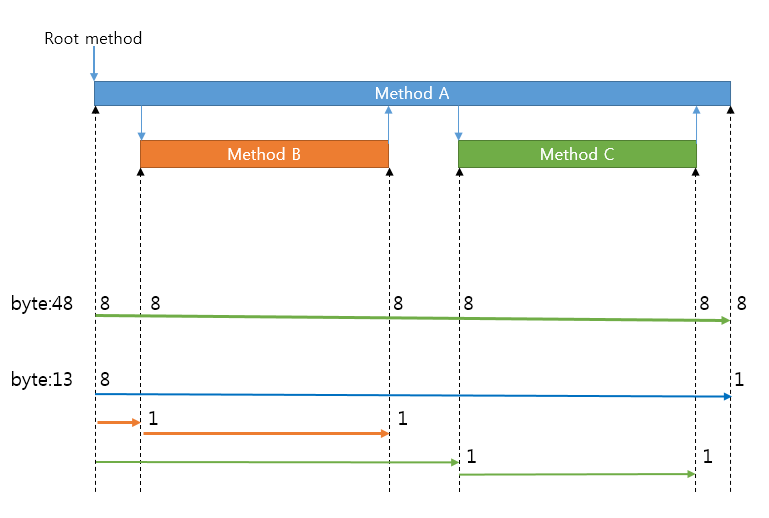
Figure 4. Comparison between fixed-length encoding and variable-length encoding
As you can see in Figure 4, you need to measure the time of 6 different points to get information of when three different methods are called and finished(Figure 4); With fixed-length encoding, this process requires 48 bytes (6points × 8bytes).
Meanwhile, Pinpoint Agent uses variable-length encoding and records the data according to its corresponding format. And calculate time information on other points with the difference(in vector value) based on the start time of the root method. Since vector value is a small number, it consumes a small number of bytes resulting only 13 bytes consumed rather than 48bytes.
If it takes more time to execute a method, it will increase the number of bytes even though variable-length encoding is used. However, it is still more efficient than fixed-length encoding.
Replacing Repeated API Information, SQLs, and Strings with Constant Tables
We wanted Pinpoint to enable code-level tracing. However, it had a problem in terms of increasing data size. Every time data with a high degree of precision is sent to a server, due to the size of the data it increased network usage.
To solve such a problem, we adopted a strategy by creating a constant table in a remote HBase server. Since there will be an overload to send data of “method A” to Pinpoint Collector each time, Pinpoint Agent converts “method A” data to an ID and stores this information as a constant table in HBase, and continue tracing data with the ID. When a user retrieves trace data on the Website, the Pinpoint Web searches for the method information of the corresponding ID in the constant table and reorganize them. The same way is used to reduce data size in SQLs or frequently-used strings.
Handling Samples for Bulk Requests
The requests to online portal services which Naver is providing are huge. A single service handles more than 20 billion requests a day. A simple way to trace such request is by expanding network infrastructure and servers as much as needed to suit the number of requests. However, this is not a cost-effective way to handle such situations.
In Pinpoint, you can collect only sampling data rather than tracking every request. In a development environment where requests are few, every data is collected. While in the production environment where requests are large, only 1~5% out of whole data is collected which is sufficient to analyze the status of entire applications. With sampling, you can minimize network overhead in applications and reduce costs of infrastructure such as networks and servers.
Sampling method in Pinpoint
Pinpoint supports a Counting sampler, which collects data only for one of 10 requests if it is set to 10. We plan to add new samplers that can collect data more effectively.
Minimizing Application Threads Being Aborted Using Asynchronous Data Transfer
Pinpoint does not interfere with application threads since encoded data or remote messages are transferred asynchronously by another thread.
Transferring Data via UDP
Unlike Google’s Dapper, Pinpoint transfers data through a network to ensure data speed. Sharing network with your service can be an issue when data traffic bursts out. In such situations, the Pinpoint Agent starts to use UDP protocol to give the network connection priority to your service.
Note
The data transfer APIs can be replaced since it’s separated as an interface. It can be changed into an implementation that stores data in a different way, like local files.
Example of Pinpoint Applied
Here is an example of how to get data from your application so that you can comprehensively understand the contents described earlier.
Figure 5 shows what you can see when you install Pinpoint in TomcatA and TomcatB. You can see the trace data of an individual node as a single transaction, which represents the flow of distributed transaction tracing.
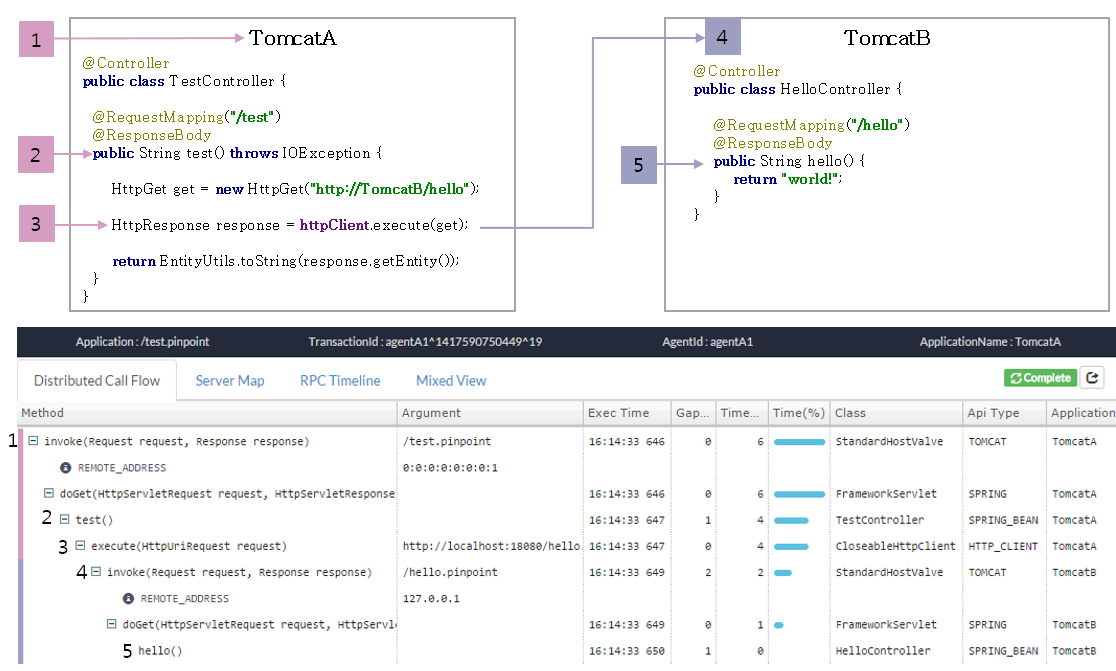
Figure 5. Example of Pinpoint in action
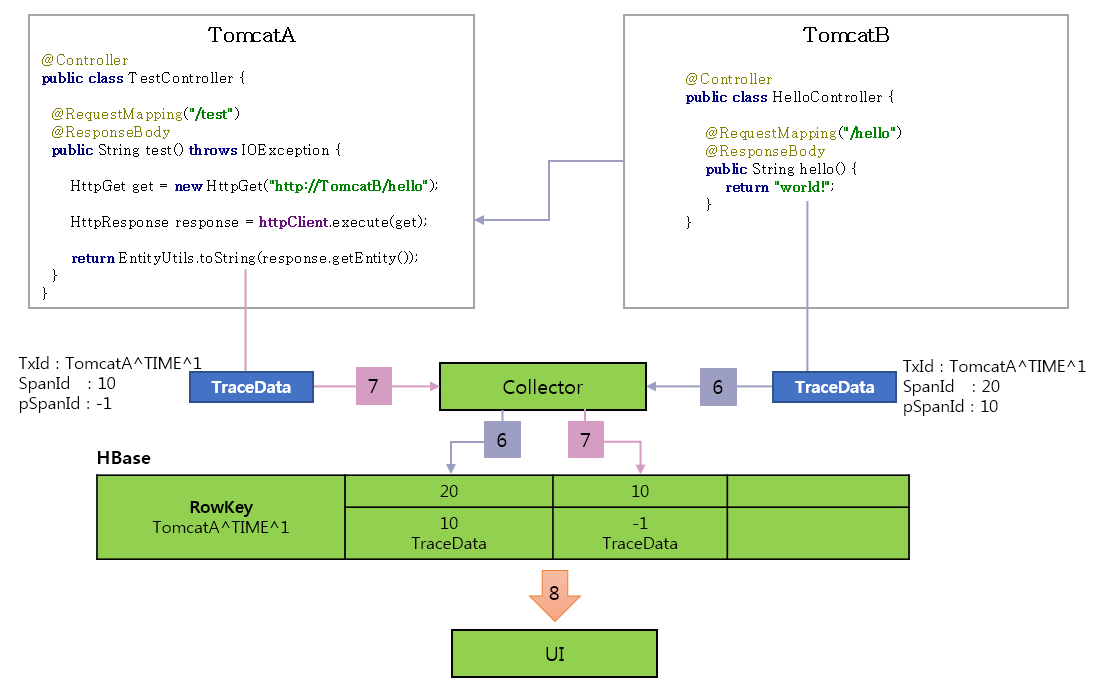
The following describes what Pinpoint does for each method.
- Pinpoint Agent issues a TraceId when a request arrives at TomcatA.
- TX_ID: TomcatA^TIME^1
- SpanId: 10
- ParentSpanId: -1(Root)
-
Records data from Spring MVC controllers.
- Intervene the calls of HttpClient.execute() method and configure the TraceId in HttpGet.
- Creates a child TraceId.
- TX_ID: TomcatA^TIME^1 -> TomcatA^TIME^1
- SPAN_ID: 10 -> 20
- PARENT_SPAN_ID: -1 -> 10 (parent SpanId) - Configures the child TraceId in the HTTP header.
- HttpGet.setHeader(PINPOINT_TX_ID, “TomcatA^TIME^1”)
- HttpGet.setHeader(PINPOINT_SPAN_ID, “20”)
- HttpGet.setHeader(PINPOINT_PARENT_SPAN_ID, “10”)
- Transfer tagged request to TomcatB.
- TomcatB checks the header from the transferred request.
- HttpServletRequest.getHeader(PINPOINT_TX_ID) - TomcatB becomes a child node as it identifies a TraceId in the header.
- TX_ID: TomcatA^TIME^1
- SPAN_ID: 20
- PARENT_SPAN_ID: 10
- Records data from Spring MVC controllers and completes the request.
-
Pinpoint Agent sends trace data to Pinpoint Collector to store it in HBase when the request from TomcatB is completed.
-
After the HTTP calls from TomcatB is terminated, then the request from TomcatA is complete. The Pinpoint Agent sends trace data to Pinpoint Collector to store it in HBase.
-
UI reads the trace data from HBase and creates a call stack by sorting trees.
Conclusions
Pinpoint is another application that runs along with your applications. Using bytecode instrumentation makes Pinpoint seem like that it does not require code modifications. In general, the bytecode instrumentation technique makes applications vulnerable to risks; if a problem occurs in Pinpoint, it will affect your applications as well. But for now, instead of getting rid of such threats, we are focusing on improving performance and design of Pinpoint. Because we think this makes Pinpoint more valuable. So whether or not to use Pinpoint is for you to decide.
We still have a large amount of work to be done to improve Pinpoint. Despite its incompleteness, Pinpoint was released as an open-source project; we are continuously trying to develop and improve Pinpoint so as to meet your expectations.
Written by Woonduk Kang
In 2011, I wrote about myself like this—As a developer, I would like to make a software program that users are willing to pay for, like those of Microsoft or Oracle. As Pinpoint was launched as an open-source project, it seems that my dreams somewhat came true. For now, my desire is to make Pinpoint more valuable and attractive to users.