Overview
Services nowadays often consist of many different components, communicating amongst themselves as well as making API calls to external services. How each and every transaction gets executed is often left as a blackbox. Pinpoint traces transaction flows between these components and provides a clear view to identify problem areas and potential bottlenecks.
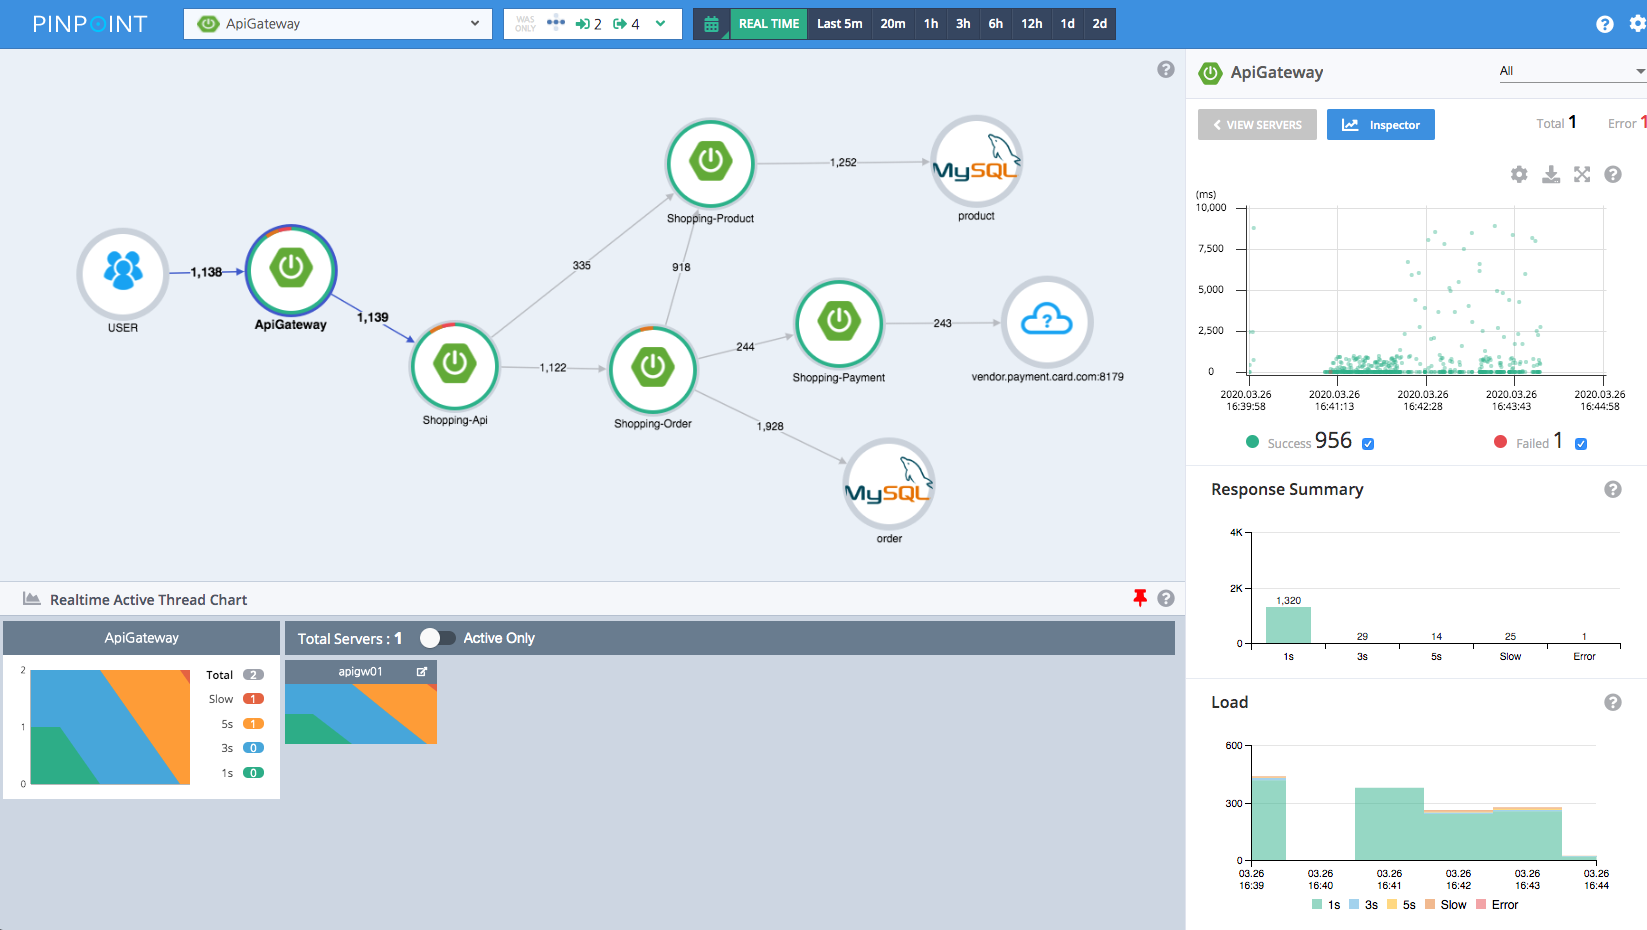
- ServerMap - Understand the topology of any distributed systems by visualizing how their components are interconnected. Clicking on a node reveals details about the component, such as its current status, and transaction count.
- Realtime Active Thread Chart - Monitor active threads inside applications in real-time.
-
Request/Response Scatter Chart - Visualize request count and response patterns over time to identify potential problems. Transactions can be selected for additional detail by dragging over the chart.
-
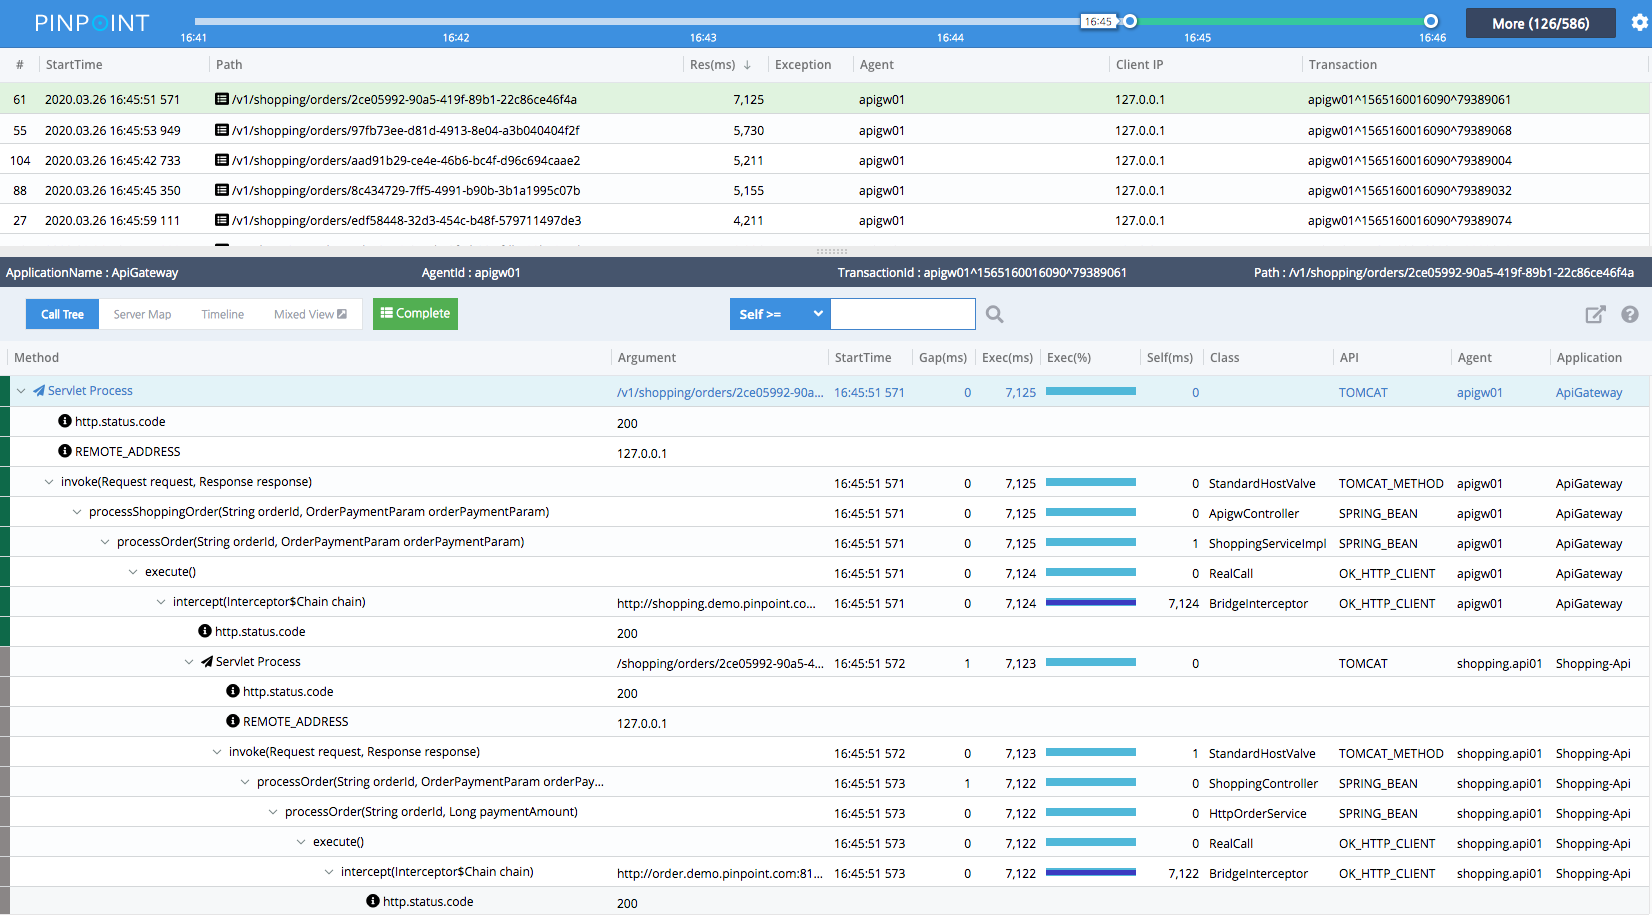
CallStack - Gain code-level visibility to every transaction in a distributed environment, identifying bottlenecks and points of failure in a single view.
-
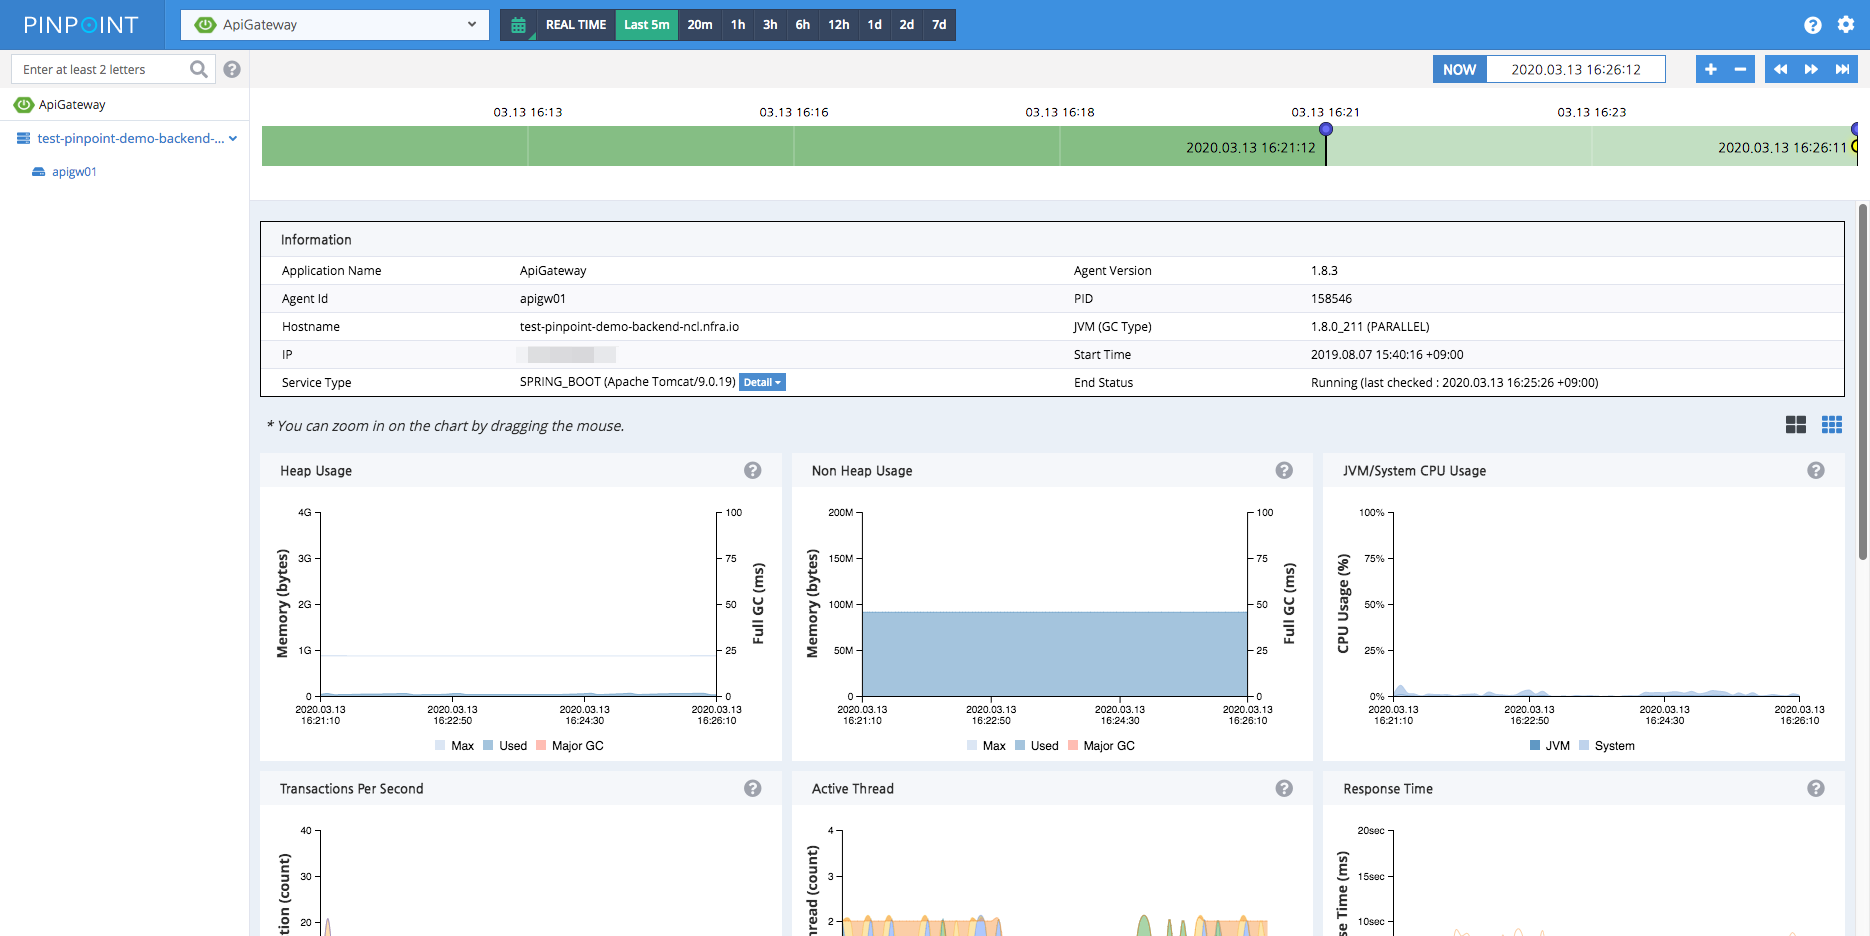
Inspector - View additional details on the application such as CPU usage, Memory/Garbage Collection, TPS, and JVM arguments.
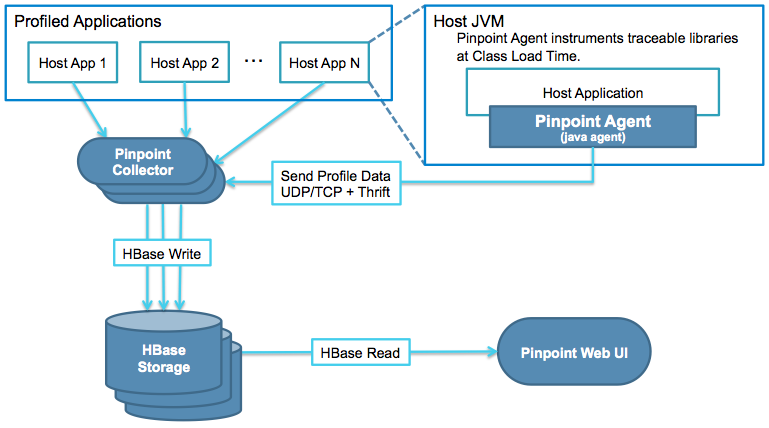
Architecture