
Introduction
Team members of Pinpoint are always aware of performance and stability issues. We’ve adapted technologies to reduced elements that hinder performance and always carefully examine the codes when there is a plugin pull requests.(plugin codes affects most in performance)
While we have been testing internally everyday for last few years, We’ve finally had the chance to make the data presentable.
This article doesn’t include results compared with other APMs. It’s pointless to compare with others due to the difference in collected data. Pinpoint collects massive data to enhance observability as much as possible. But still with minimum impact on the performance
Test Environment
JVM : 1.8.0_77 (G1, -Xms4g, -Xmx4g)
Server : Tomcat
Database : Cubrid
Stress test generator : NGrinder
Test Result
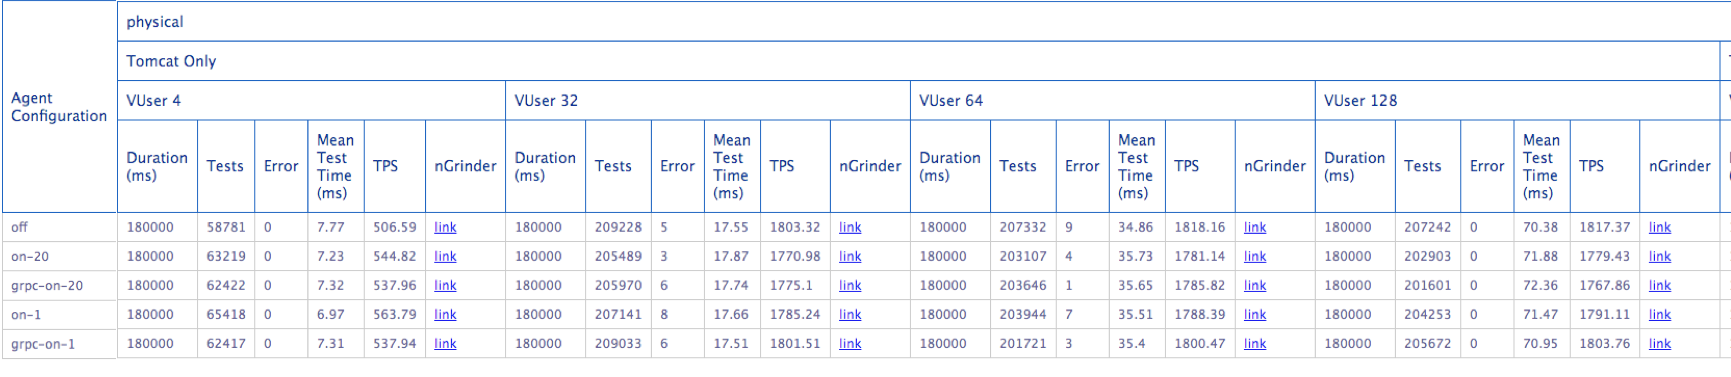
*off : non traced
*on-20 : trace 5% transaction using thrift
*grpc-on-20 : trace 5% transaction using grpc
*on-1 : trace 100% transaction using thrift
*grpc-on-1 : trace 100% transaction using grpc
Test result shows that Pinpoint affects less than 3% in performance and memory
TPS is effected by various reasons, which may not always be exact
gRPC is little slow than thrift in this test, the performance gap between the two is expected to be reduced, or even more, reversed in v1.9.0 release
Conclusion
Pinpoint is already being used in dozens of global companies in the world. With right environment and configuration it’s been proved to be worthy. We believe most of the services can spare their 3% of resource to gain high observability with Pinpoint.
Check List
If you still have low performance issue due to Pinpoint. Here are several items to check in advance.
- Check the default log option for Pinpoint-Agent (Default was
DEBUGprior to v1.8.1) - JVM option
- use G1 for the GC Type
- fix initial/maximum memory allocation pool with same size. ex) -Xms4g -Xmx4g
- Change sampling rate. Even 1~2% would be enough if you are dealing big data.
When certain transaction doesn’t bypass database, it may appear that Pinpoint is consuming much more resources than 3%, since instrumentation time is not relative, but absolute. But this phenomenon appears in all APM, not only Pinpoint.
Reference Data
We run test with various technology stacks. Planning to expand more as we go.
Full Result