
Application Inspector
1. Introduction
Application inspector provides an aggregate view of all the agent’s resource data (cpu, memory, tps, datasource connection count, etc) registered under the same application name. A separate view is provided for the application inspector with stat charts similar to the agent inspector.
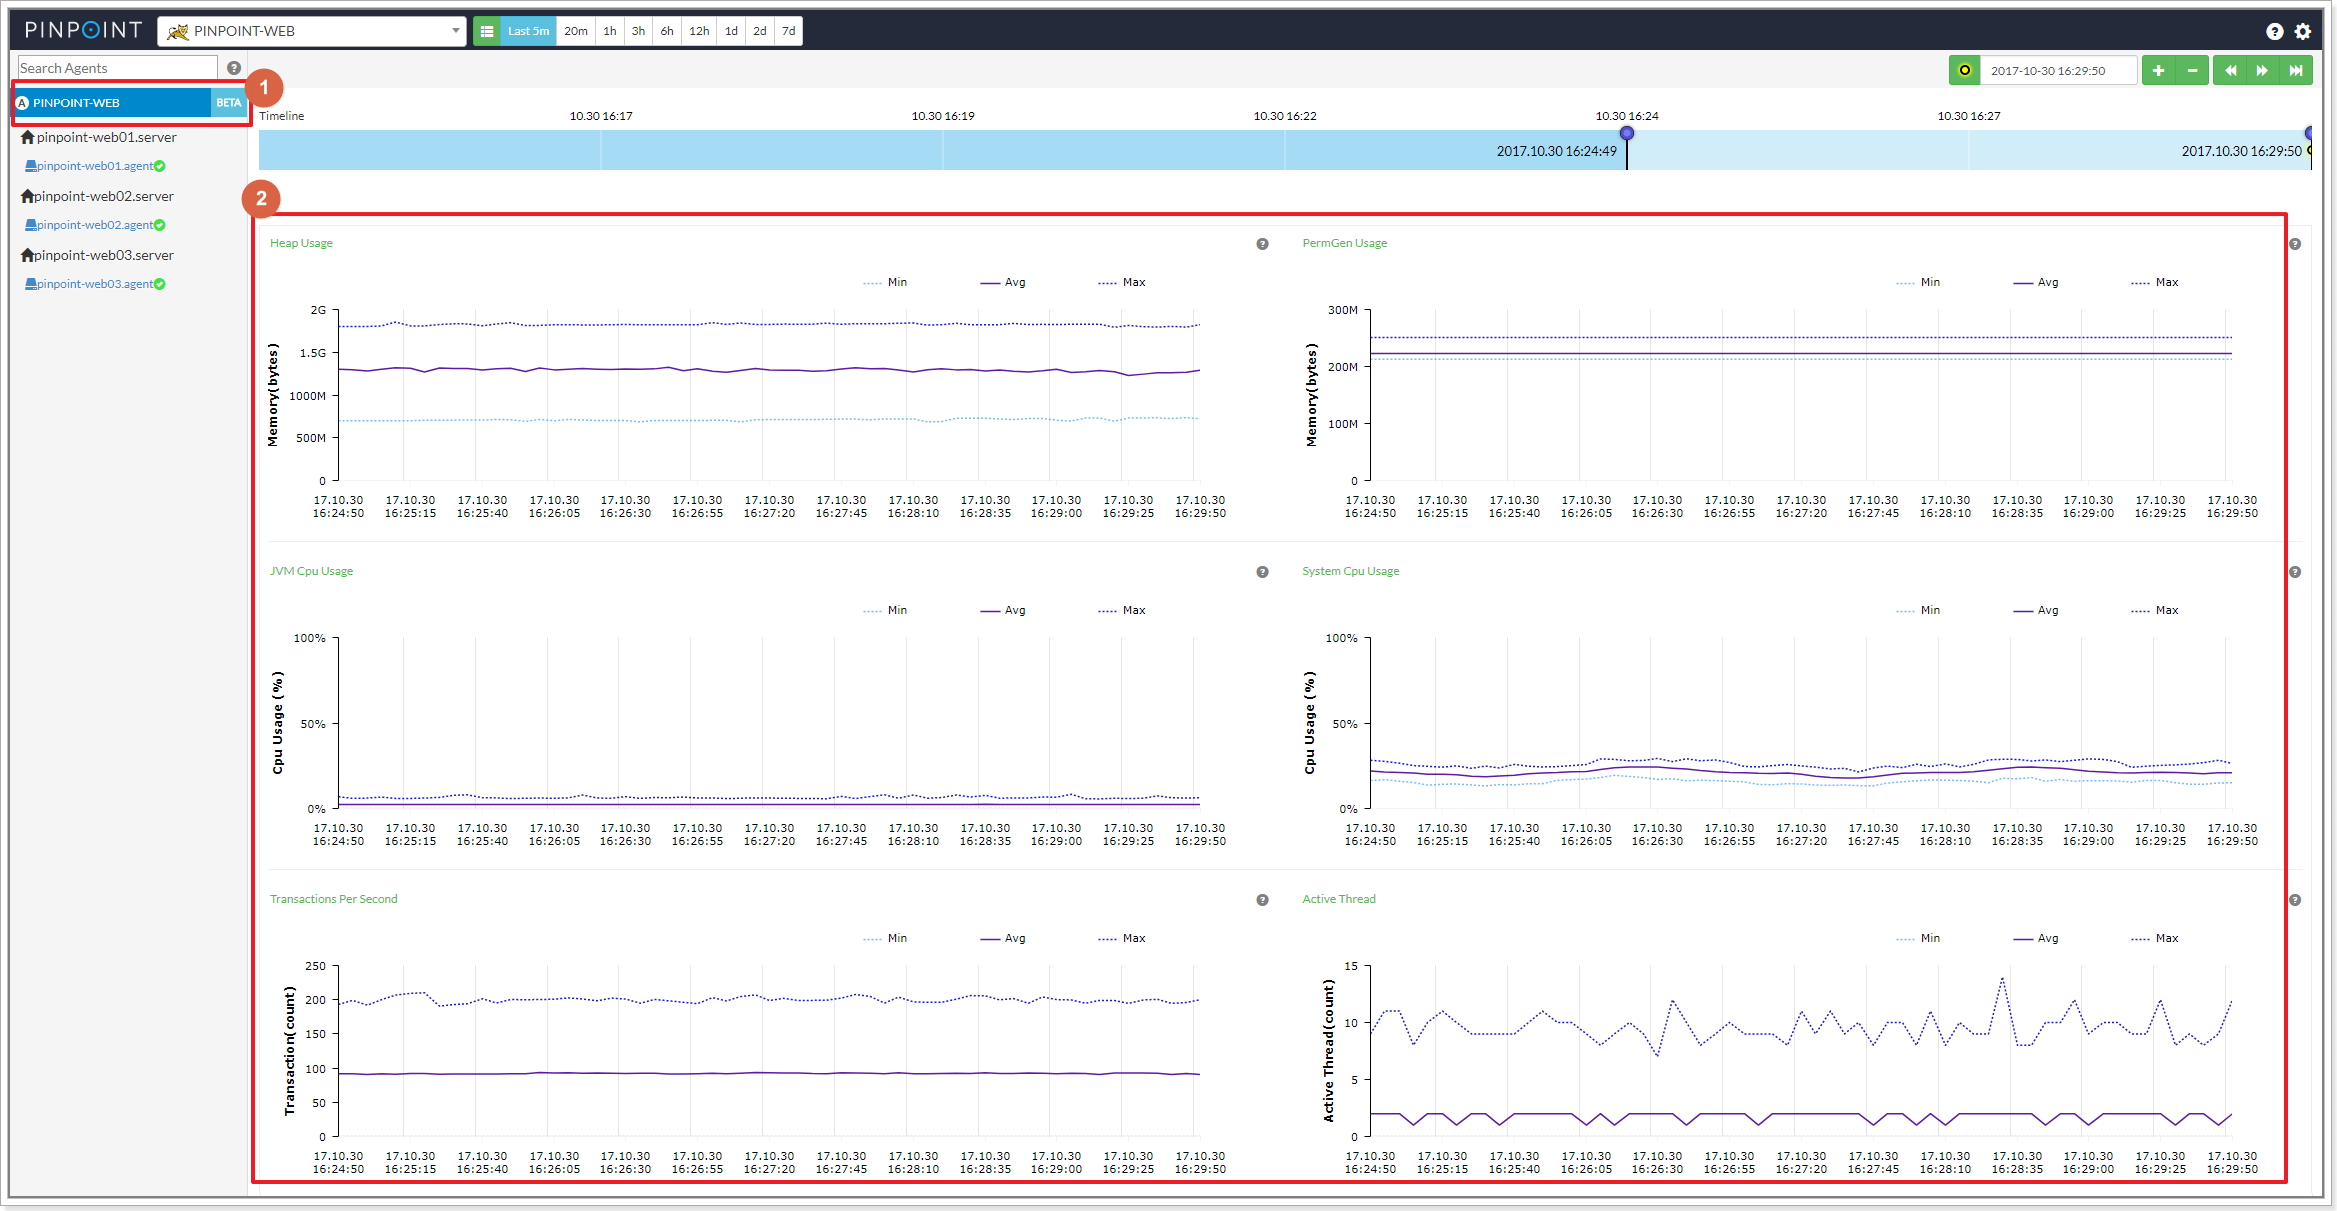
To access application inspector, click on the application inspector menu on the left side of the screen.
- 1 : application inspector menu, 2 : application stat data
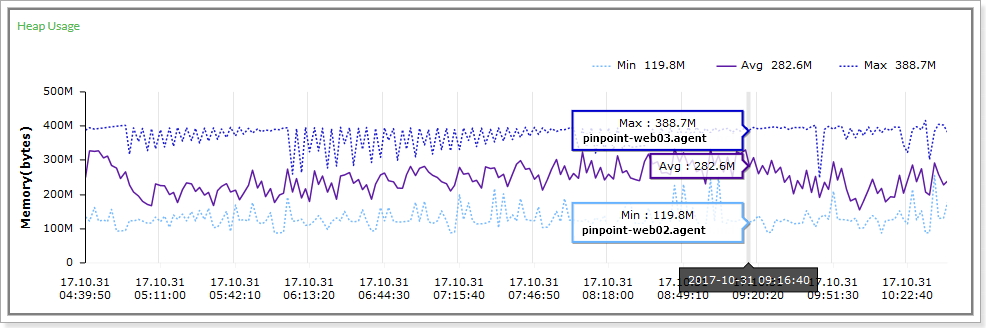
The Heap Usage chart above for example, shows the average(Avg), smallest(Min), greatest(Max) heap usage of the agents registered under the same application name along with the id of the agent that had the smallest/greatest heap usage at a certain point in time. The application inspector also provides other statistics found in the agent inspector in a similar fashion.
Application inspector requires flink and zookeeper. Please read on for more detail.
2. Architecture
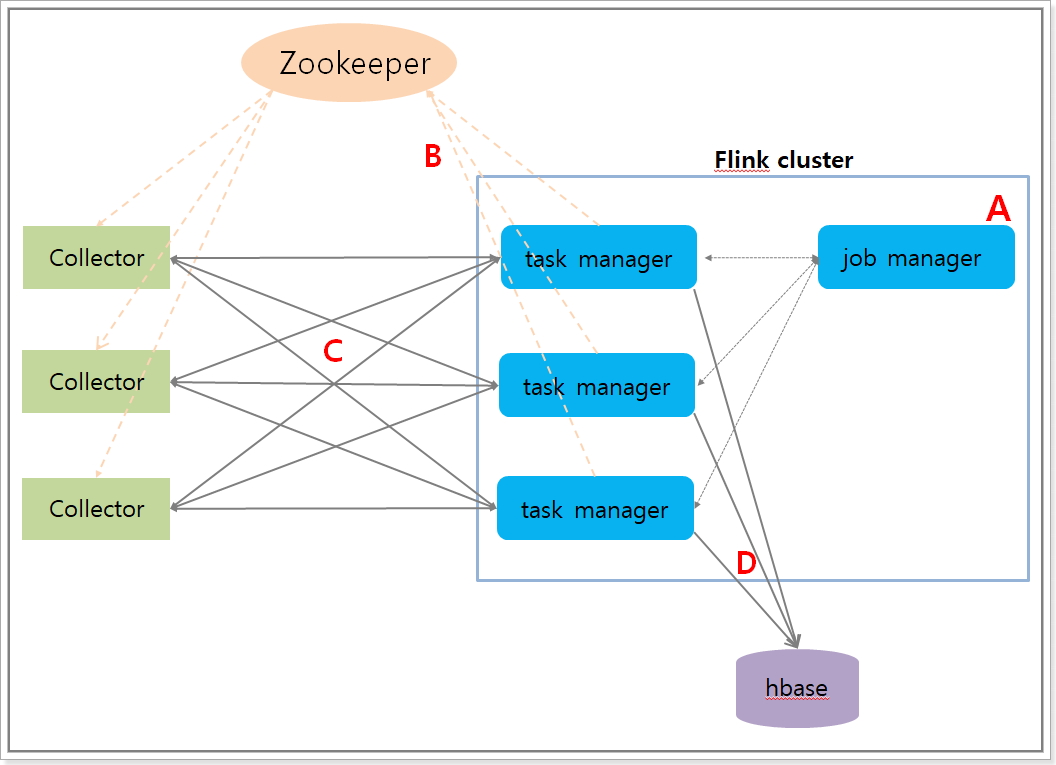
A. Run a streaming job on flink.
B. The taskmanager server is registered to zookeeper as a data node once the job starts.
C. The Collector obtains the flink server info from zookeeper to create a tcp connection with it and starts sending agent data.
D. The flink server aggregates data sent by the Collector and stores them into hbase.
3. Configuration
In order to enable application inspector, you will need to do the following and run Pinpoint.
A. Create ApplicationStatAggre table (refer to create table script), which stores application stat data.
B. Configure zookeeper address in Pinpoint-flink.properties which will be used to store flink’s taskmanager server information.
    flink.cluster.enable=true
    flink.cluster.zookeeper.address=YOUR_ZOOKEEPER_ADDRESS
    flink.cluster.zookeeper.sessiontimeout=3000
    flink.cluster.zookeeper.retry.interval=5000
    flink.cluster.tcp.port=19994
C. Configure job execution type and the number of listeners to receive data from the Collector in Pinpoint-flink.properties.
- If you are running a flink cluster, set flink.StreamExecutionEnvironment to server, and flink.sourceFunction.Parallel to the number of task manager servers.
- If you are running flink as a standalone, set flink.StreamExecutionEnvironment to local, and flink.sourceFunction.Parallel to 1.
  flink.StreamExecutionEnvironment=server
  flink.sourceFunction.Parallel=1
D. Configure hbase address in hbase.properties which will be used to store aggregated application data.
    hbase.client.host=YOUR_HBASE_ADDRESS
    hbase.client.port=2181
E. Build Pinpoint-flink and run the streaming job file created under target directory on the flink server.
- The name of the streaming job is
pinpoint-flink-job.2.0.jar. - For details on how to run the job, please refer to the flink website.
F. Configure zookeeper address in Pinpoint-Collector.properties so that the Collector can connect to the flink server.
    flink.cluster.enable=true
    flink.cluster.zookeeper.address=YOUR_ZOOKEEPER_ADDRESS
    flink.cluster.zookeeper.sessiontimeout=3000
G. Enable application inspector in the web-ui by enabling the following configuration in pinpoint-web.properties.
config.show.applicationStat=true
4. Monitoring Streaming Jobs
There is a batch job that monitors how Pinpoint streaming jobs are running. To enable this batch job, configure the following files for Pinpoint-web.
batch.properties
batch.flink.server=FLINK_MANGER_SERVER_IP_LIST
# Flink job manager server IPs, separated by ','.
# ex) batch.flink.server=123.124.125.126,123.124.125.127
applicationContext-batch-schedule.xml
<task:scheduled-tasks scheduler="scheduler">
	...
	<task:scheduled ref="batchJobLauncher" method="flinkCheckJob" cron="0 0/10 * * * *" />
</task:scheduled-tasks>
If you would like to send alarms in case of batch job failure, you must implement com.navercorp.pinpoint.web.batch.JobFailMessageSender class and register it as a Spring bean.
5. Others
For more details on how to install and operate flink, please refer to the flink website.
Application Inspector
1. 기능 설명
application inspector 기능은 agent들의 리소스 데이터(stat : cpu, memory, tps, datasource connection count)를 집계하여 데이터를 보여주는 기능이다. 참고로 application은 agent의 그룹으로 이뤄진다. 그리고 agent의 리소스 데이터는 agent inspector 화면에서 에서 볼 수 있다. application inspector 기능 또한 별도의 화면에서 확인할 수 있다.
inspector 화면 왼쪽 메뉴의 링크를 클릭하면 application inspector 버튼을 클릭하고 데이터를 볼 수 있다.
- 1 : application inspector menu, 2: application stat data
예를들면 A라는 application에 포함된 agent들의 heap 사용량을 모아서 heap 사용량 평균값 , heap 사용량의 평균값, heap 사용량이 가장 높은 agentid와 사용량, heap 사용량이 가장 적은 agentid와 사용량을 보여준다. 이외에도 agent inspector 에서 제공하는 다른 데이터들도 집계하여 application inspector에서 제공한다.
application inspector 기능을 동작시키기 위해서는 flink와 zookeeper가 필요하고, 기능의 동작 구조와 구성 및 설정 방법을 아래 설명한다.
2. 동작 구조
application inspector 기능의 동작 및 구조를 그림과 함께 보자.
A. flink에 streaming job을 실행시킨다.
B. job이 실행되면 taskmanager 서버의 정보가 zookeeper의 데이터 노드로 등록이 된다.
C. Collector는 zookeeper에서 flink 서버의 정보를 가져와서 flink 서버와 tcp 연결을 맺고 agent stat 데이터를 전송한다.
D. flink 서버에서는 agent 데이터를 집계하여 통계 데이터를 hbase에 저장한다.
3. 기능 실행 방법
application inspector 기능을 실행하기 위해서 아래와 같이 설정을 변경하고 Pinpoint를 실행해야 한다.
A. 테이블 생성 스크립트를 참조하여 application 통계 데이터를 저장하는 ApplicationStatAggre 테이블을 생성한다.
B. flink 프로젝트 설정파일(Pinpoint-flink.properties)에 taskmanager 서버 정보를 저장하는 zookeeper 주소를 설정한다.
    flink.cluster.enable=true
    flink.cluster.zookeeper.address=YOUR_ZOOKEEPER_ADDRESS
    flink.cluster.zookeeper.sessiontimeout=3000
    flink.cluster.zookeeper.retry.interval=5000
    flink.cluster.tcp.port=19994
C. flink 프로젝트 설정파일(Pinpoint-flink.properties)에 job의 실행 방법과 Collector에서 데이터를 받는 listener의 개수를 설정한다.
- flink를 cluster로 구축해서 사용한다면 flink.StreamExecutionEnvironment에는 server를 설정하고 flink.sourceFunction.Parallel에는 task manager 서버의 개수만큼 설정한다.
- flink를 Standalone 형태로 실행한다면 flink.StreamExecutionEnvironment에는 local을 설정하고 flink.sourceFunction.Parallel에는 1을 설정하면 된다.
    flink.StreamExecutionEnvironment=server
    flink.sourceFunction.Parallel=1
D. flink 프로젝트 설정파일(hbase.properties)에 집계 데이터를 저장하는 hbase 주소를 설정한다.
    hbase.client.host=YOUR_HBASE_ADDRESS
    hbase.client.port=2181
E. flink 프로젝트를 빌드하여 target 폴더 하위에 생성된 streaming job 파일을 flink 서버에 job을 실행한다.
- streaming job 파일 이름은
pinpoint-flink-job.2.0.jar이다. - 실행방법은 flink 사이트를 참조한다.
F. Collector에서 flink와 연결을 맺을 수 있도록 설정파일(Pinpoint-Collector.porperties)에 zookeeper 주소를 설정한다.
    flink.cluster.enable=true
    flink.cluster.zookeeper.address=YOUR_ZOOKEEPER_ADDRESS
    flink.cluster.zookeeper.sessiontimeout=3000
G. web에서 application inspector 버튼을 활성화 하기 위해서 설정파일(pinpoint-web.porperties)을 수정한다.
config.show.applicationStat=true
4. streaming job 동작 확인 모니터링 batch
Pinpoint streaming job이 실행되고 있는지 확인하는 batch job이 있다. batch job을 동작 시키고 싶다면 Pinpoint web 프로젝트의 설정 파일을 수정하면 된다.
batch.properties
batch.flink.server=FLINK_MANGER_SERVER_IP_LIST
#`batch.flink.server` 속성 값에 flink job manager 서버 IP를 입력하면 된다. 서버 리스트의 구분자는 ','이다.
# ex) batch.flink.server=123.124.125.126,123.124.125.127
applicationContext-batch-schedule.xml
<task:scheduled-tasks scheduler="scheduler">
	...
	<task:scheduled ref="batchJobLauncher" method="flinkCheckJob" cron="0 0/10 * * * *" />
</task:scheduled-tasks>
batch job이 실패할 경우 알람이 전송되도록 기능을 추가 하고싶다면 com.navercorp.pinpoint.web.batch.JobFailMessageSender class 구현체를 만들고 bean으로 등록하면 된다.
5. 기타
자세한 flink 운영 설치에 대한 내용은 flink 사이트를 참고하자.